01
Model setup
The model uses approximately 1.45 million cells and represents two inlet regions feeding a domain with one outlet.
Project Case Study
Flow distribution, water age, turbulence and circulation in a reservoir domain with two inlet regions and one outlet region.
Computational cells
1.45 million
Domain diagonal
Approx. 25 m
Turbulence model
Realisable k-ε
Boundaries
2 inlets, 1 outlet
Project summary
The model represents a reservoir/lake domain with two inlet regions and one outlet region. The study focuses on velocity distribution, water-age (residence-time) patterns, turbulence kinetic energy and three-dimensional circulation.
Results include velocity contours, water-age contours and volume renderings, streamlines and turbulence kinetic energy.
Computational cells
1.45 million
Domain diagonal
Approx. 25 m
Reservoir depth parameter
FD1 = 3,000 mm
Turbulence model
Realisable k-ε with Enhanced Wall Function
Primary outputs
Velocity contours, water-age contours and volume renderings, streamlines, turbulence kinetic energy
Reported values
Values are transcribed from the supplied report. The report contains differing water-age ranges for contour and volume-rendering views; these are retained as stated rather than reconciled.
| Parameter | Reported value / setup | Interpretation in source report |
|---|---|---|
| Computational cells | 1.45 million | Mesh used for the flow simulation |
| Domain diagonal | Approx. 25,000 mm (25 m) | Overall diagonal dimension of modelled geometry |
| Reservoir depth parameter | FD1 = 3,000 mm | Geometry parameter reported on page 1 |
| Velocity contour range | Approx. 0–0.18 m/s | Higher velocity along principal flow paths |
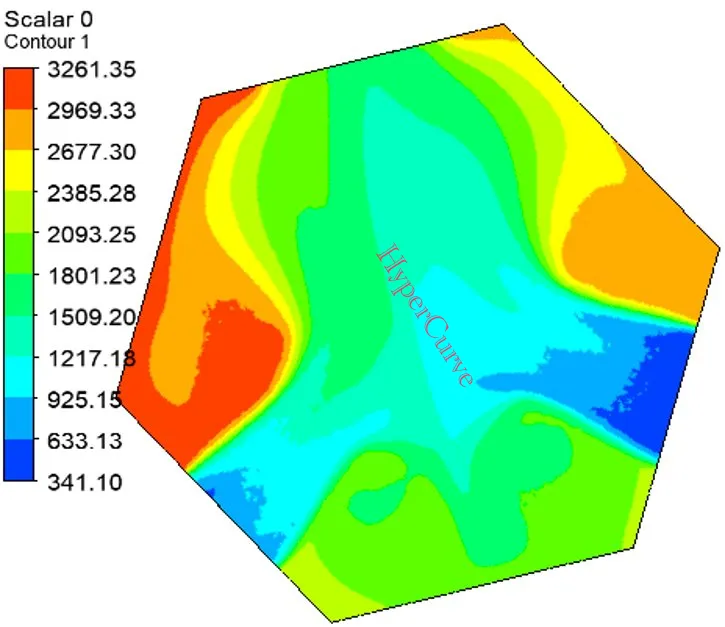
| Water age, contour | Approx. 341–3,261 s | Lower age near inlets; older water in slower-exchange zones |
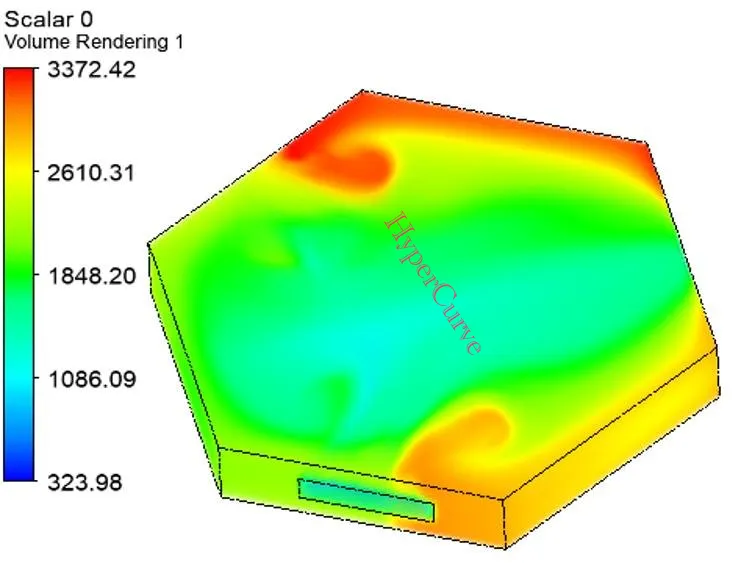
| Water age, 3D renderings | Approx. 324–3,372 s | Peripheral/recirculation regions show higher residence time |
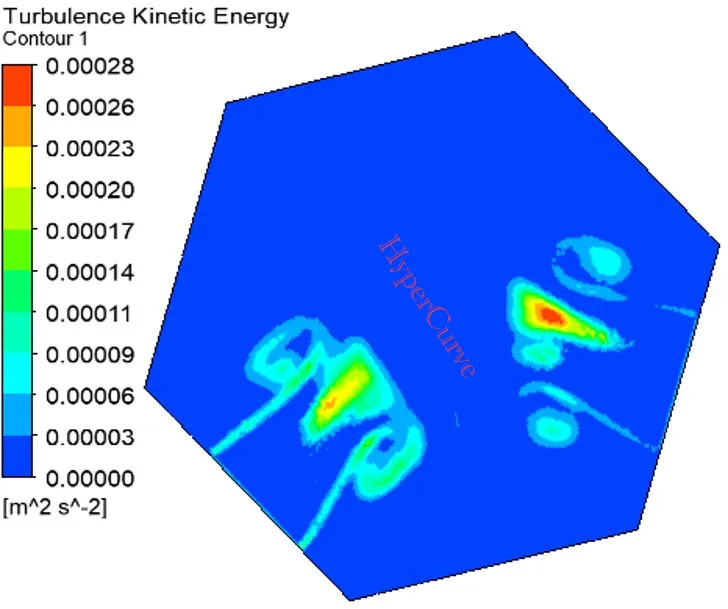
| Turbulence kinetic energy | Approx. 0–0.00028 m²/s² | Turbulence concentrated near inlet regions |
Model preparation
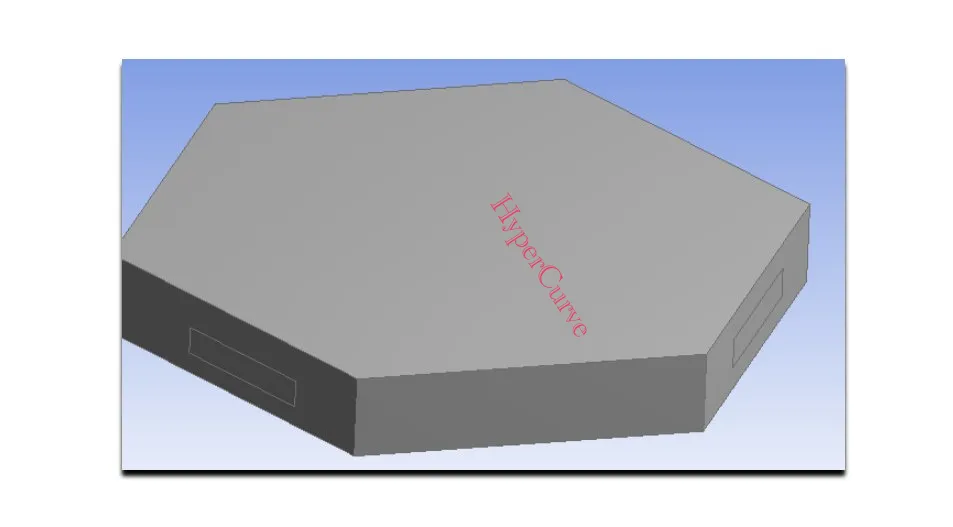
The CAD geometry is a polygonal reservoir domain with a depth parameter of 3,000 mm and an overall computational-domain diagonal of approximately 25 m. The CFD domain contains approximately 1.45 million computational cells.
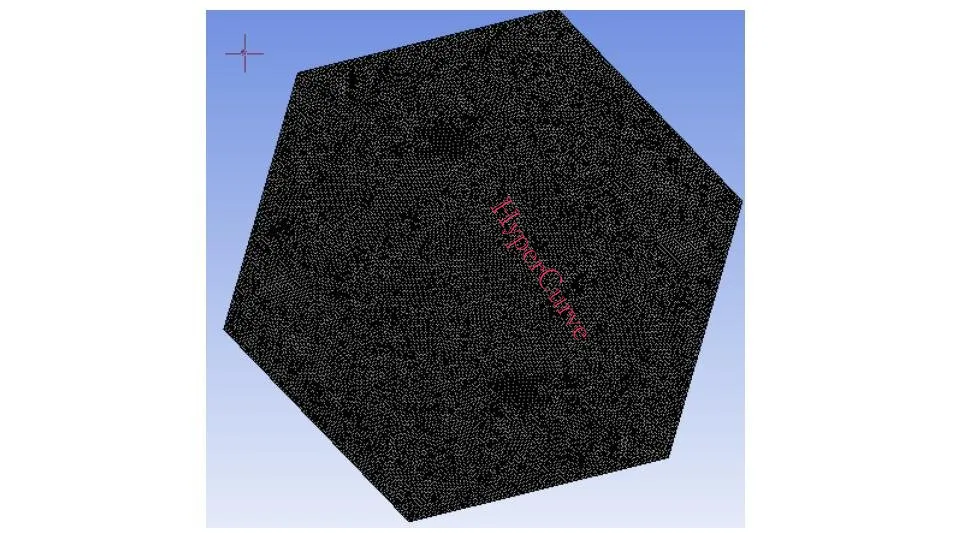
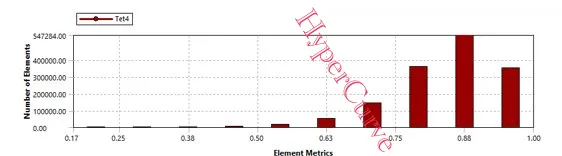
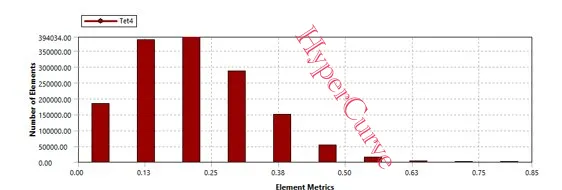
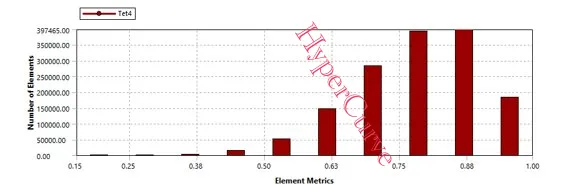
The source report includes element quality, skewness and orthogonal-quality plots, but does not provide a tabulated mesh-independence study or a numerical acceptance threshold for these metrics.
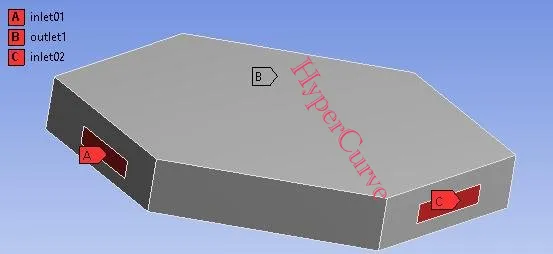
The boundary layout shows two inlet regions (inlet01, inlet02) and one outlet region (outlet1). The supplied document does not state numerical inlet flow rates, inlet velocities or outlet pressure values, so these values are not inferred here.
Simulation setup
| Setting | Reported configuration |
|---|---|
| Viscous model | Realisable k-ε with Enhanced Wall Function |
| Pressure–velocity coupling | Coupled |
| Gradient | Least Squares Cell-Based |
| Pressure discretisation | Second Order |
| Momentum discretisation | Second Order Upwind |
| Turbulent kinetic energy | Second Order Upwind |
| Turbulent dissipation rate | Second Order Upwind |
| Pseudo-transient | Enabled |
| Energy / multiphase / radiation | Off |
| User-defined scalar | 1 scalar; inlet diffusion enabled; flux function: mass flow rate |
The report lists a cell-zone source-term setup for a zone named “solid” with material “water-liquid”, zero mass and momentum source terms, and one source for User Scalar 0. It is reproduced as reported; its intended physical interpretation should be confirmed against the original solver case before reuse.
Simulation results
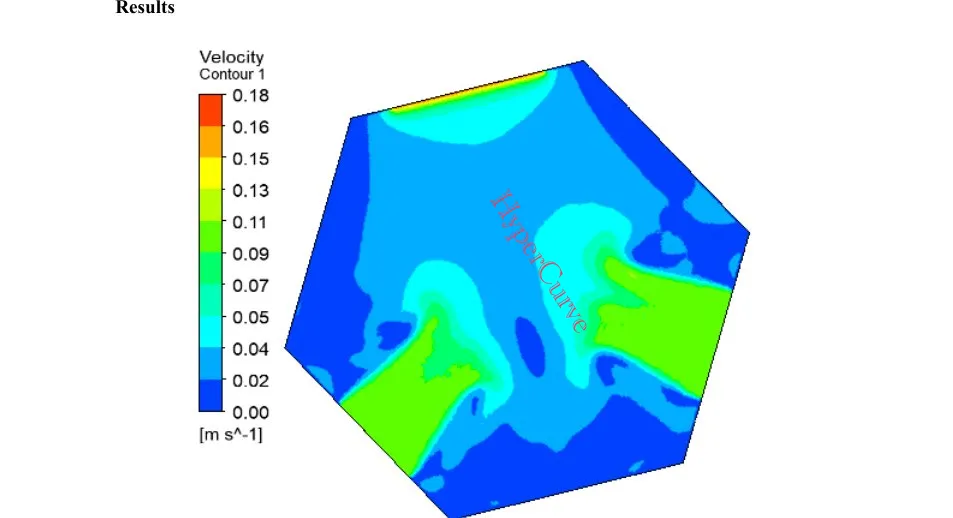
The report describes localised higher-velocity regions near the two inlet boundaries. As the incoming flows move through the domain, velocity becomes more distributed, with lower-velocity regions farther from the inlet paths and toward portions of the outlet-side domain. The contour scale spans approximately 0 to 0.18 m/s.
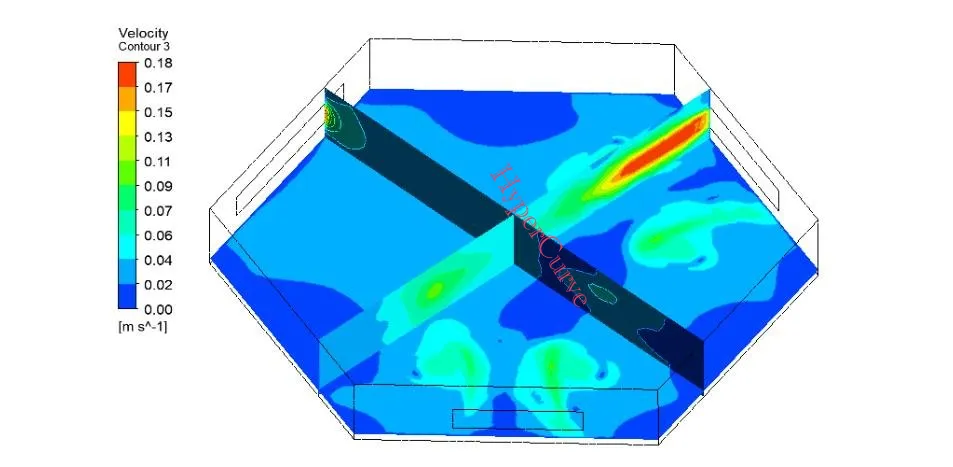
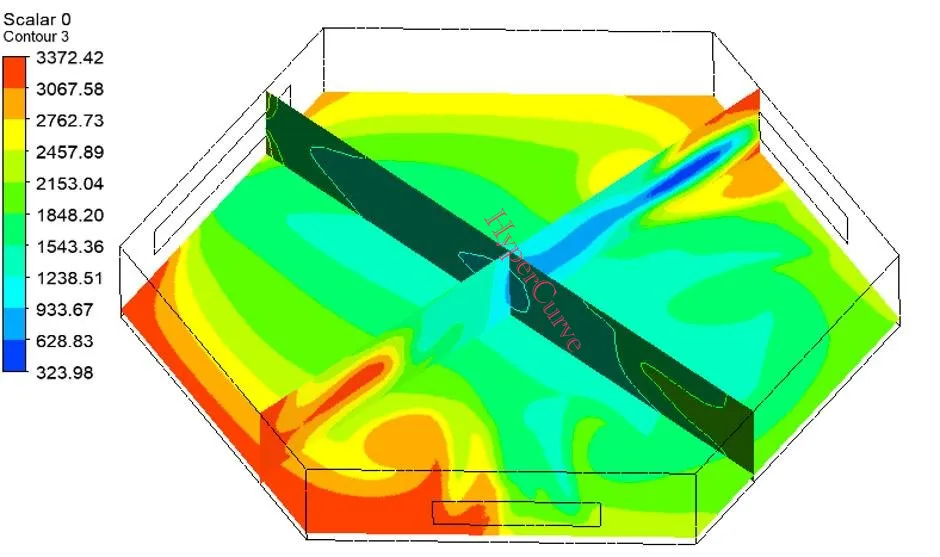
The cross-sectional view supports a qualitative assessment of circulation and hydraulic connectivity; design adequacy would require the project flow rates and performance criteria.
Residence time
The report interprets lower water-age values as relatively fresh incoming water and higher values as water that has remained within the domain longer. The contour-plane range is approximately 341–3,261 seconds, while volume-rendering views report approximately 324–3,372 seconds, with higher water age in peripheral and recirculation regions.
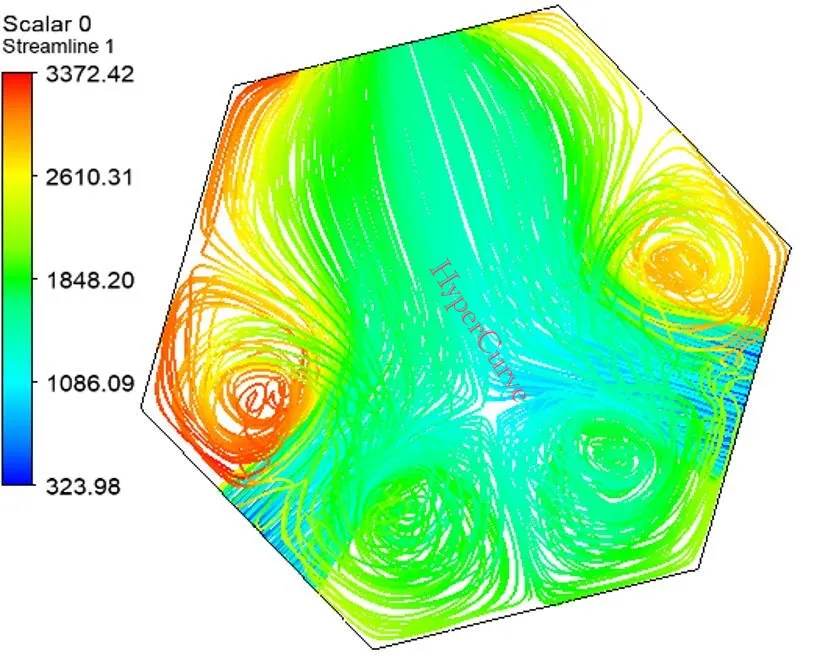
The streamlines show multiple circulation loops, particularly near inlet and peripheral regions, which the report notes may influence mixing efficiency and residence time before water reaches the outlet.
Flow behaviour
Turbulence kinetic energy is reported to range from approximately 0 to 0.00028 m²/s². Higher values are concentrated near the inlet regions where incoming water interacts with the surrounding flow; the central and outlet-side regions show comparatively lower turbulence.
Engineering interpretation
01
The model uses approximately 1.45 million cells and represents two inlet regions feeding a domain with one outlet.
02
Velocity reaches approximately 0–0.18 m/s, with higher velocities along selected flow paths.
03
Water-age plots identify lower-residence-time regions near incoming flow and higher-residence-time regions around peripheral and recirculation zones.
04
Turbulence kinetic energy is concentrated mainly near the inlet regions.
05
The report provides useful qualitative circulation patterns, but does not document numerical inlet/outlet flow values, convergence history, validation data or a mesh-independence study in the supplied pages.
Next steps
Technical basis: the supplied Hydrodynamic CFD Analysis Sample Project (HyperCurve, 2026, 13 pages). This page summarises the report without independent validation of the CFD model.