Riddhi Taranto — Underground Car Park CFD Analysis
A two-basement ventilation study examining airflow, carbon monoxide distribution and fire-driven smoke behaviour in an enclosed car park in Hyderabad.
2 Levels
Basement 1 and Basement 2
6 ACPH
Normal ventilation mode
12 ACPH
Fire ventilation mode
4 MW
Design passenger-car fire
Project at a Glance
Underground car park ventilation assessment
This case study summarises the supplied Riddhi Taranto CFD report for validation of a ductless car park ventilation system against the project CAD drawings and fan specifications.
Location
Levels Assessed
Basement Zones
Ventilation Modes
Fire Scenario
Outputs
Project Overview
Assessing airflow, carbon monoxide and fire-driven smoke
This case study summarises the supplied CFD report for the underground car park at Riddhi Taranto, Hyderabad. The report assesses a ductless impulse-ventilation system against the project CAD geometry and fan specifications, examining airflow, carbon monoxide (CO), smoke concentration, sight length and temperature for Basement 1 (B1) and Basement 2 (B2).
Project Objectives
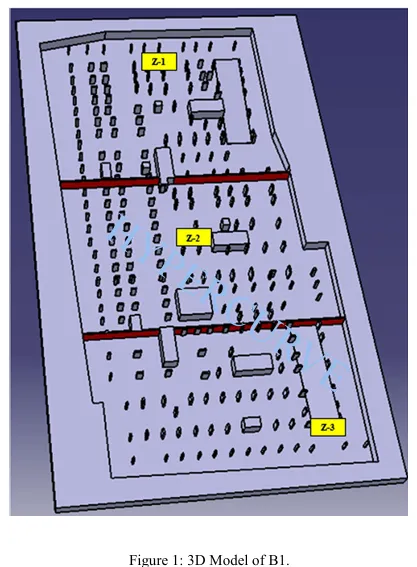
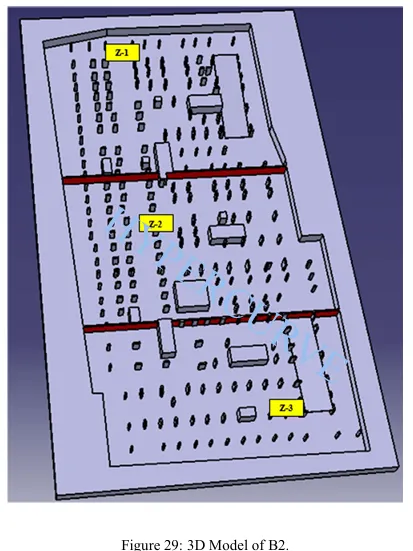
Car Park Geometry and Zones
Ventilation System
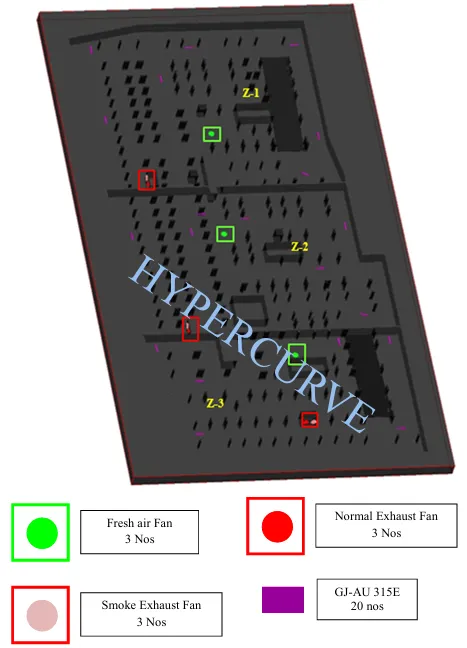
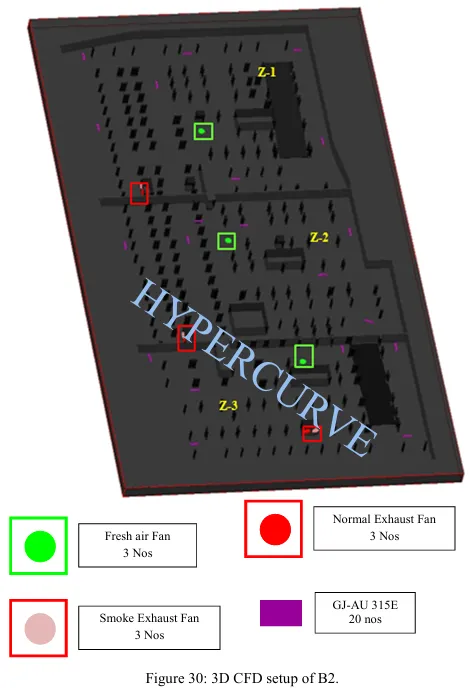
Ductless impulse ventilation and fan arrangement
The report specifies GJ-AU315E jet impulse fans, with 20 units per basement and a zone distribution of 7, 7 and 6. The fan table lists 1,236 m³/s in the report's half-thrust column and a velocity of 7.5 m/s for normal operation, and 2,472 m³/s and 15 m/s at full thrust for fire operation. Axial fresh-air, parking-exhaust and smoke-exhaust fans are listed by zone with capacities in CFM.
Normal Operation
Fire Operation
CFD Methodology and Scenarios
Steady-state airflow and transient CO and fire simulations
The report describes a three-dimensional steady-state simulation for airflow and transient simulations for CO and fire. It identifies the K-ε turbulence model and accounts for geometry and obstructions such as parked vehicles, surrounding buildings, lifts, lobbies and staircases.
3D Geometry
The model includes the CAD-based basement geometry and obstructions including vehicles, surrounding buildings, lifts, lobbies and staircases.
Airflow Analysis
A three-dimensional steady-state simulation is used to assess airflow under the defined normal ventilation conditions.
Transient Analysis
Transient simulations examine CO distribution and fire-driven smoke behaviour over time under the specified operating scenarios.
Carbon Monoxide Assessment
Reviewing CO distribution across both basement levels
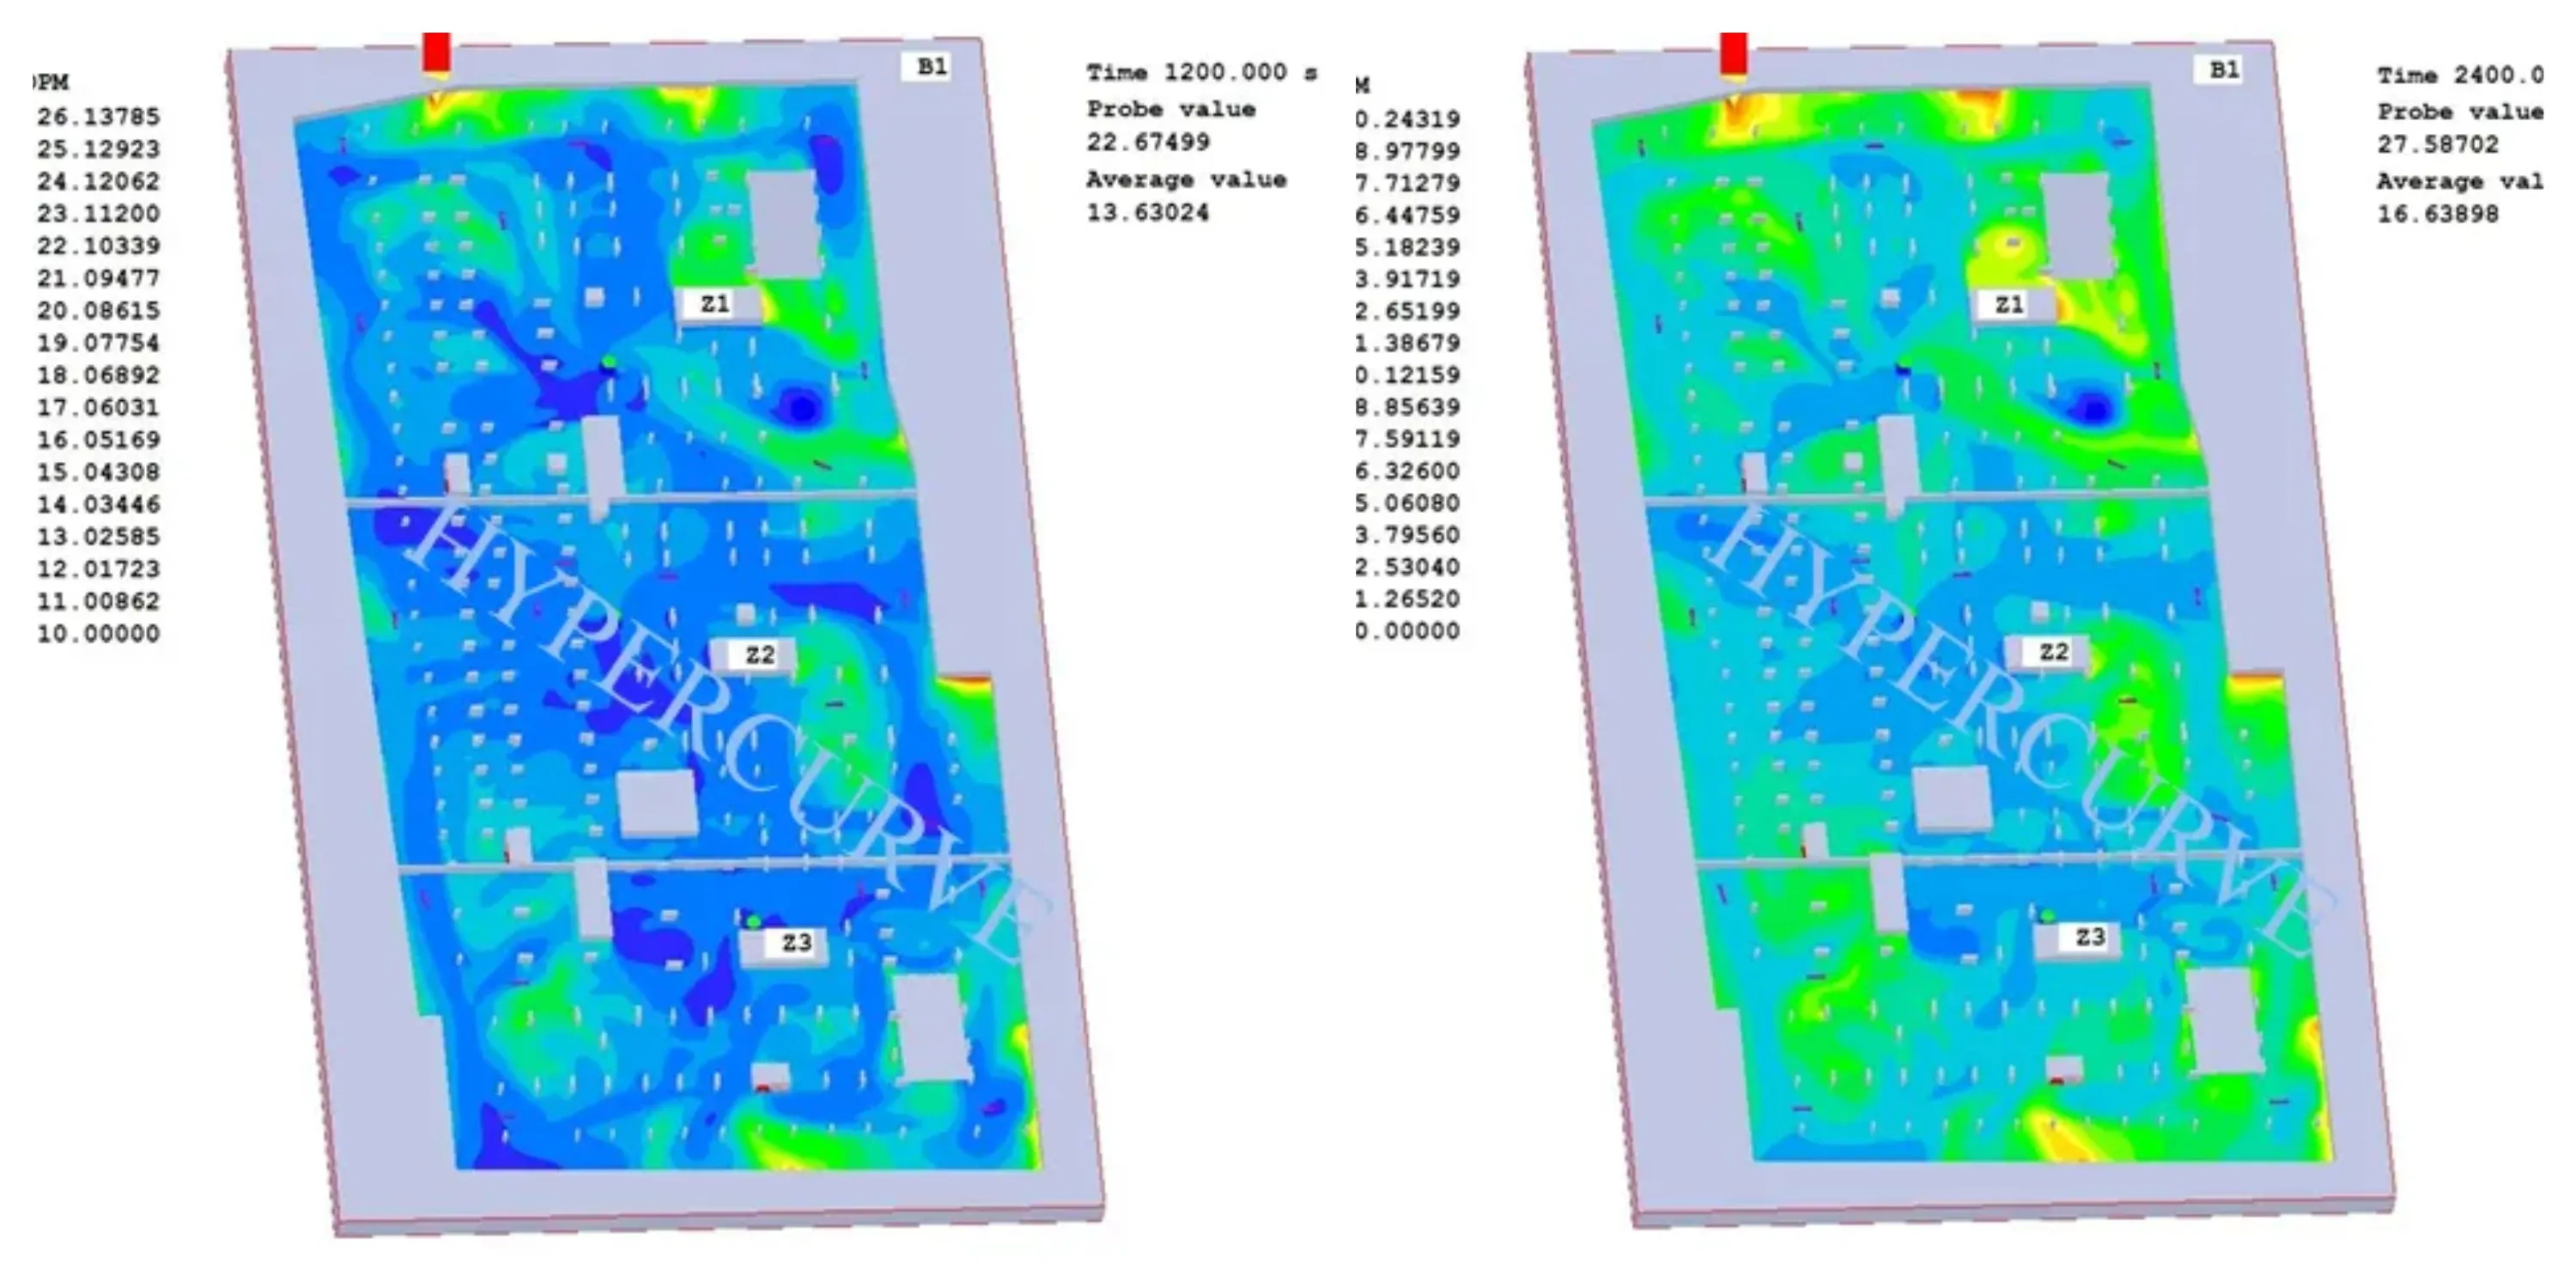
The report models CO sources across the basement to represent vehicle emissions under a stated worst-case scenario. It uses an average vehicle emission rate of 185 mg/s and a 10% factor. The report's CO criteria reference 35 ppm for one-hour exposure and 25 ppm for eight-hour exposure. The plotted B1 and B2 contours show the spatial distribution at adult height (1.7 m) at 20, 40 and 60 minutes.
Average vehicle emission rate
185 mg/s
Emission factor
10%
One-hour exposure criterion
35 ppm
Eight-hour exposure criterion
25 ppm
These are criteria referenced by the supplied report and are not independent verification of performance or compliance.
Airflow Results — Basement 1
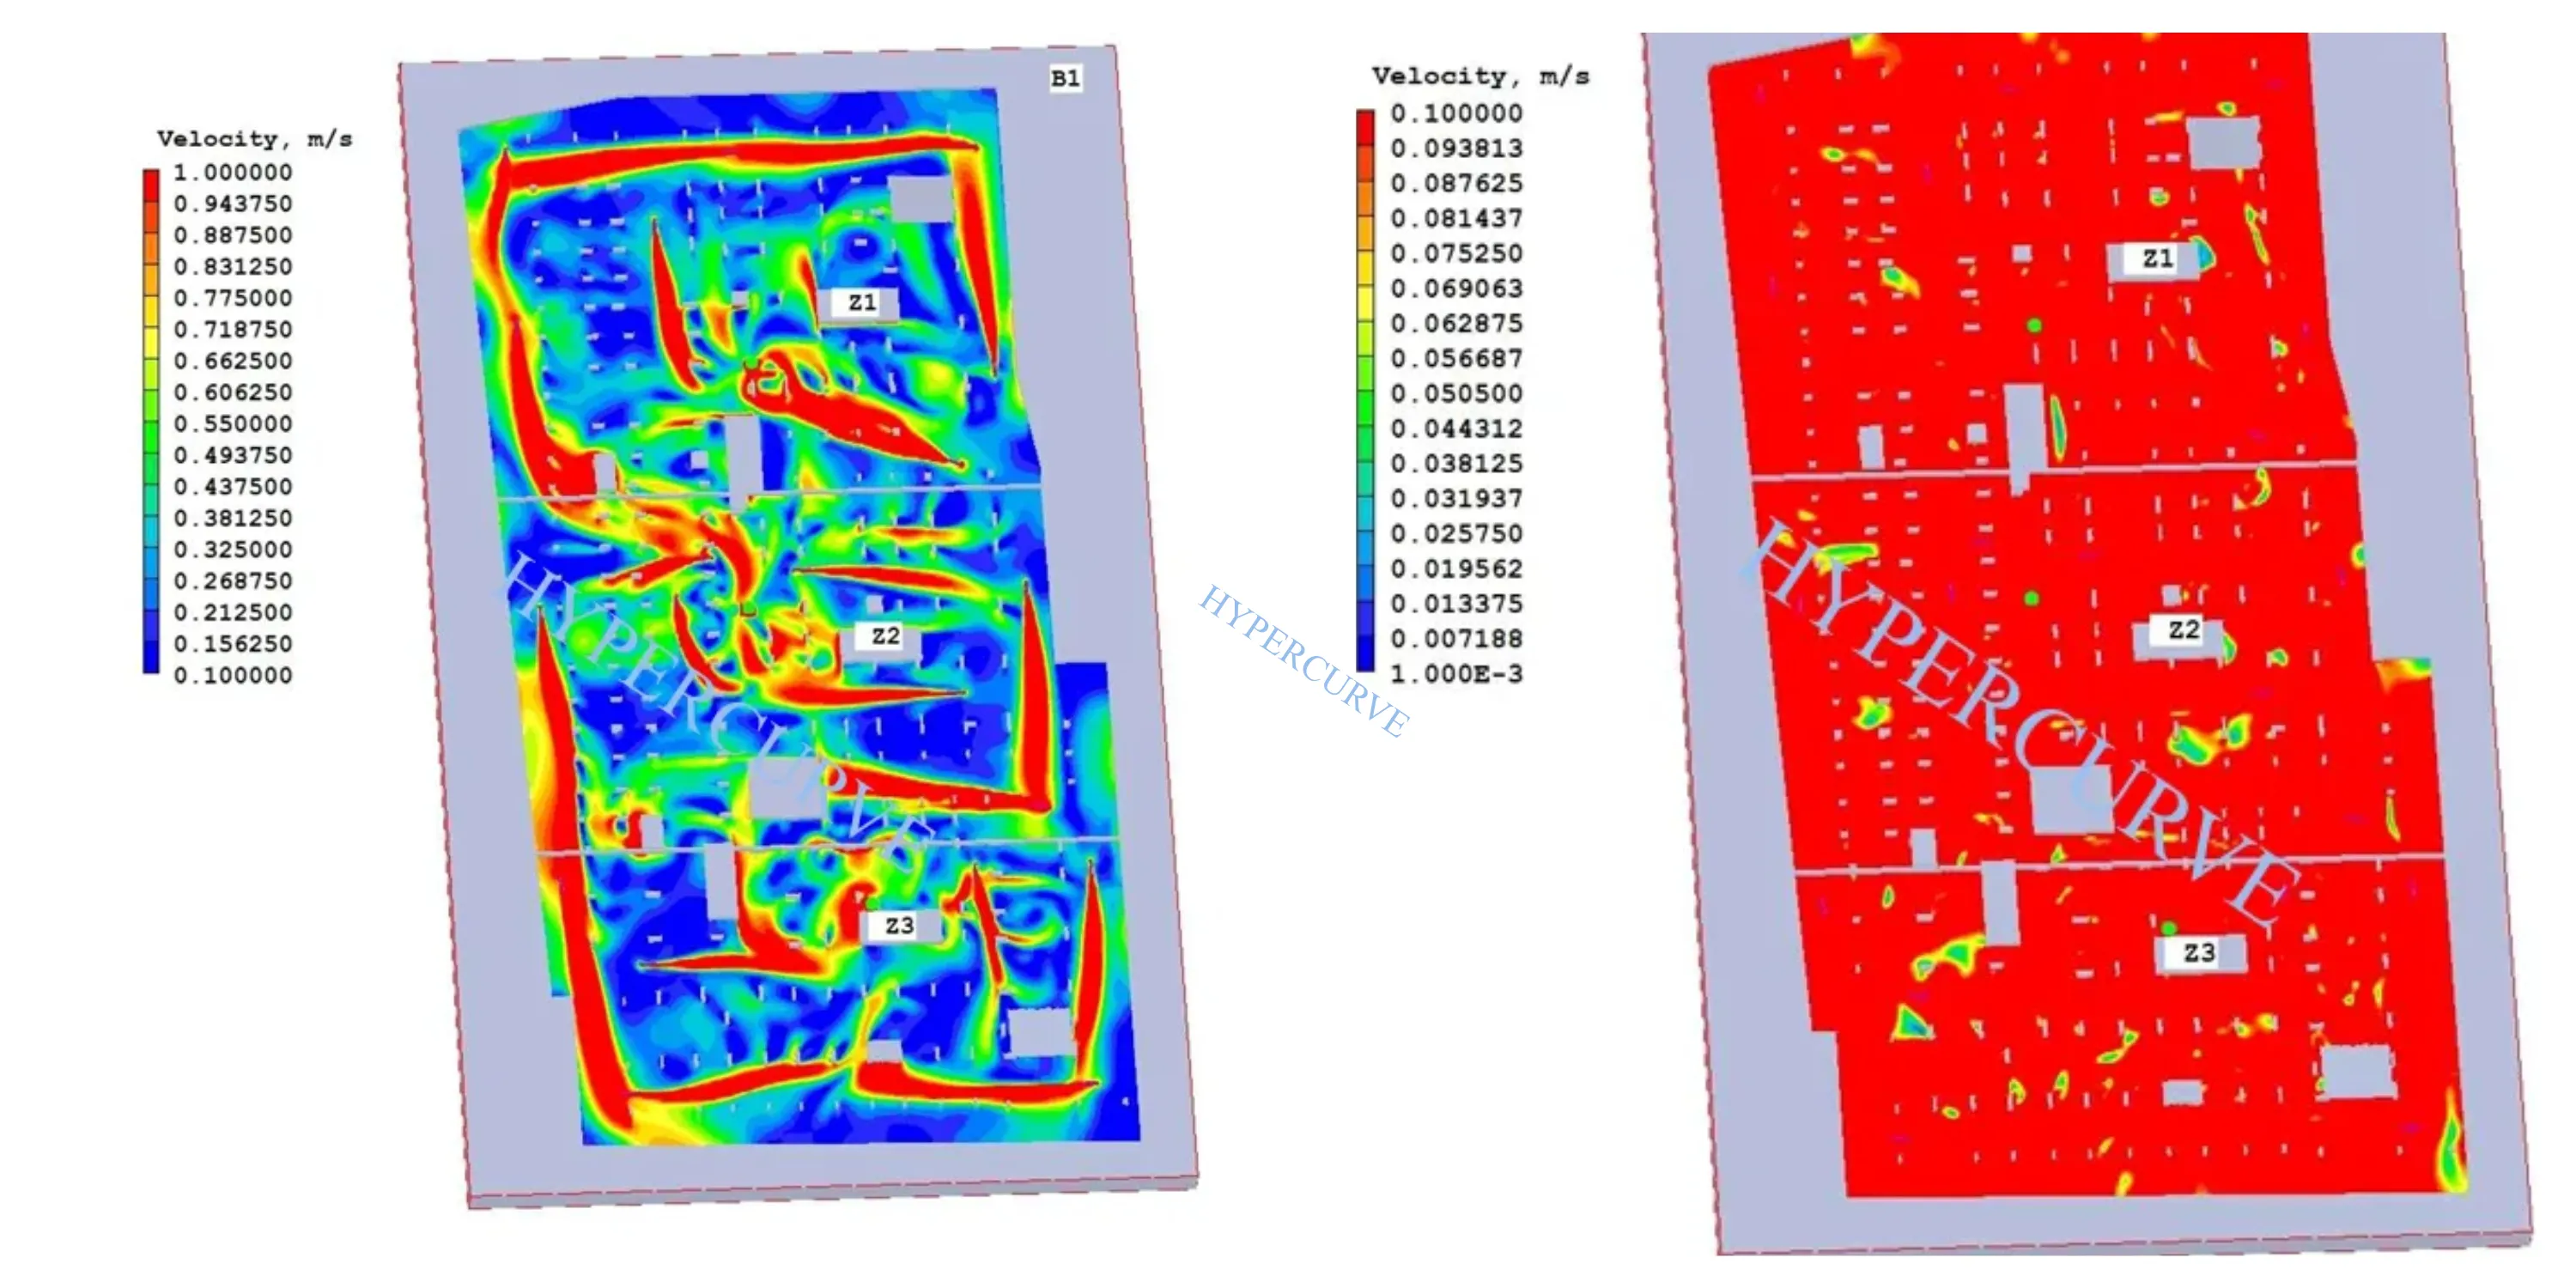
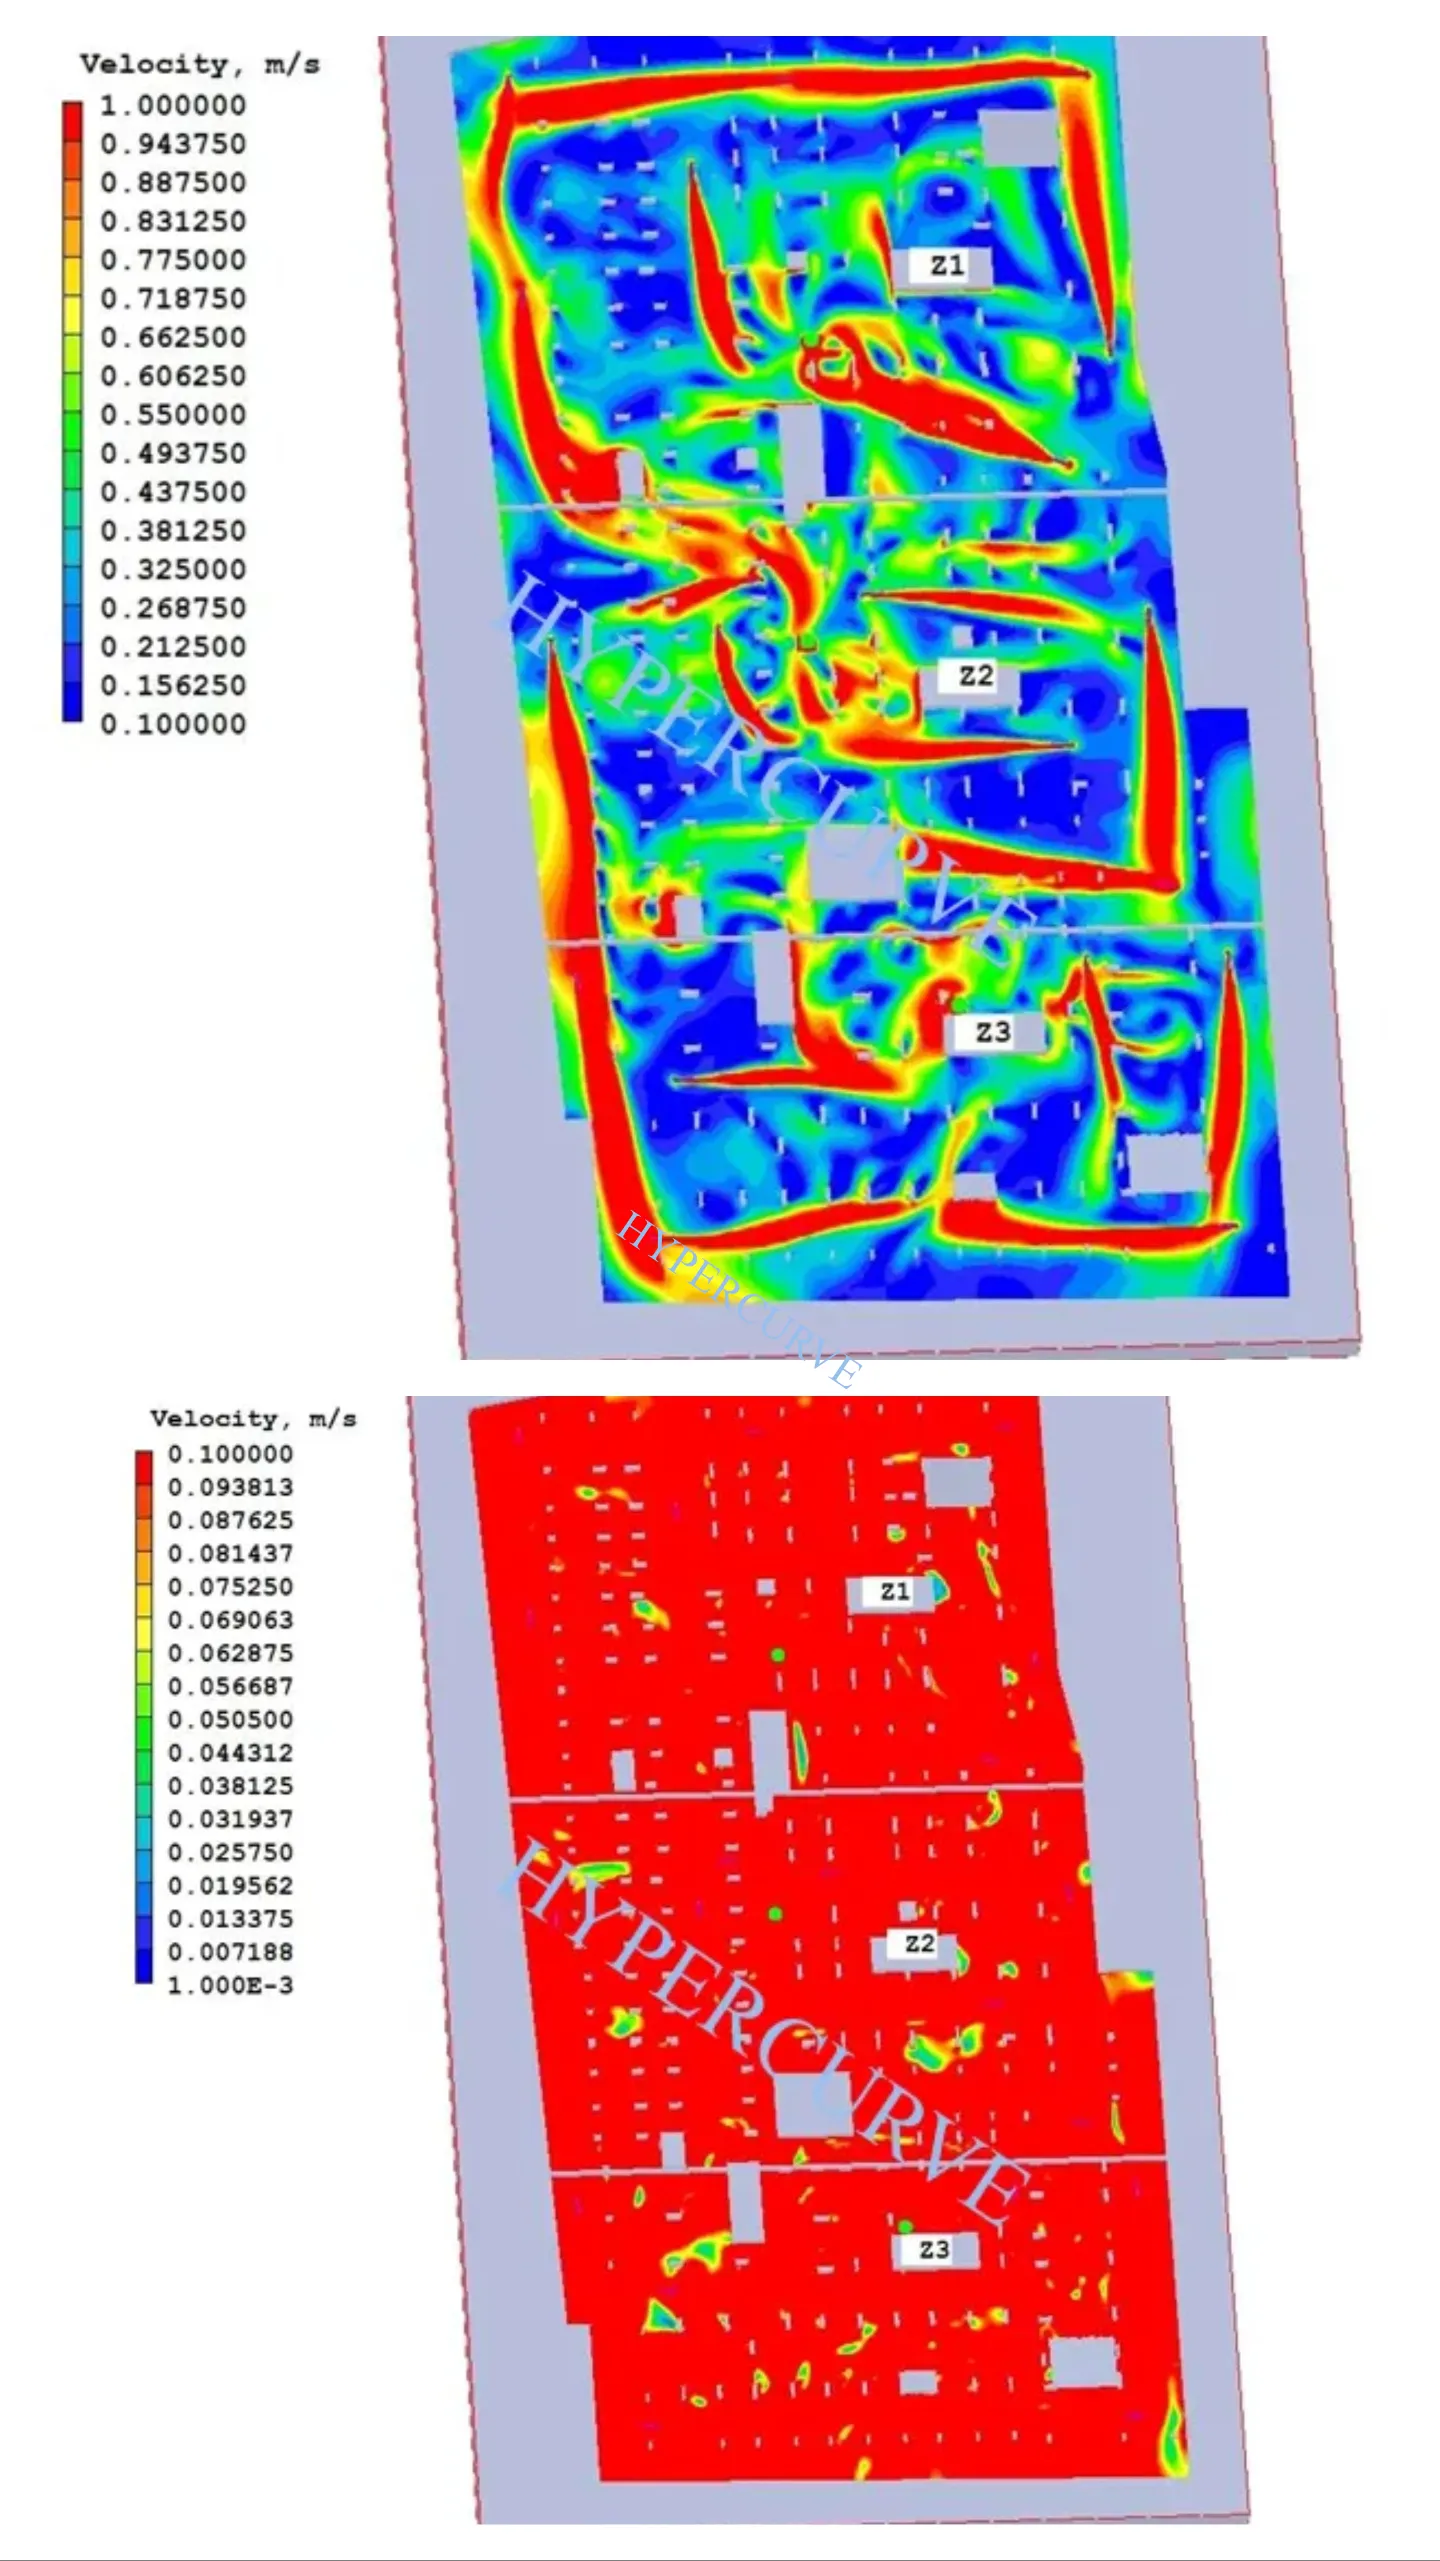
The B1 airflow figures show velocity contours at fan height (2.5 m) and adult height (1.7 m), with reference levels of 1 m/s and 0.1 m/s. These views help identify the main flow paths created by the impulse fans and areas with lower air movement. The report notes that velocities up to 0.1 m/s are insufficient for CO extraction.
CO Results — Basement 1
The B1 CO figures present concentration contours at 1.7 m for 20, 40 and 60 minutes. They illustrate how concentrations vary by location and over the simulated period. The results should be interpreted against the report's stated exposure criteria and the original simulation output.
Fire and Smoke Results — Basement 1
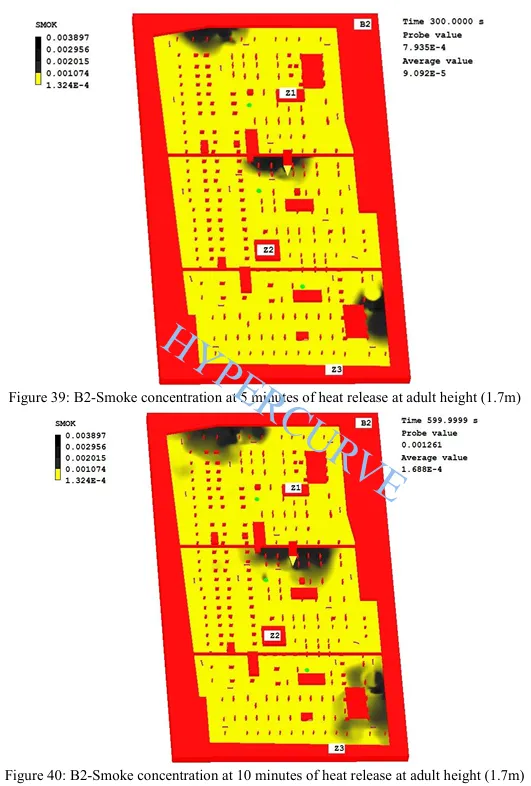
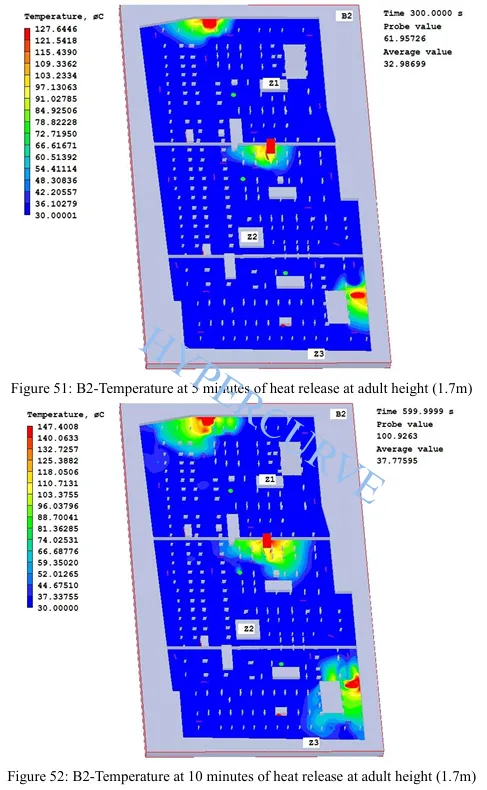
The report uses a 4 MW passenger-car fire over a 2 m × 5 m area. The heat-release curve rises linearly to 4 MW over 300 seconds, remains constant until 900 seconds and declines to zero by 1,200 seconds. Smoke concentration and sight-length contours are presented at 5, 10, 15, 20, 25 and 32 minutes at 1.7 m height, alongside temperature contours over the same period.
Airflow and CO Results — Basement 2
The B2 airflow figures show velocity contours at fan height (2.5 m) and adult height (1.7 m), using reference levels of 1 m/s and 0.1 m/s. CO concentration plots at 1.7 m are provided for 20, 40 and 60 minutes to review pollutant distribution under the modelled ventilation arrangement.
Fire and Smoke Results — Basement 2
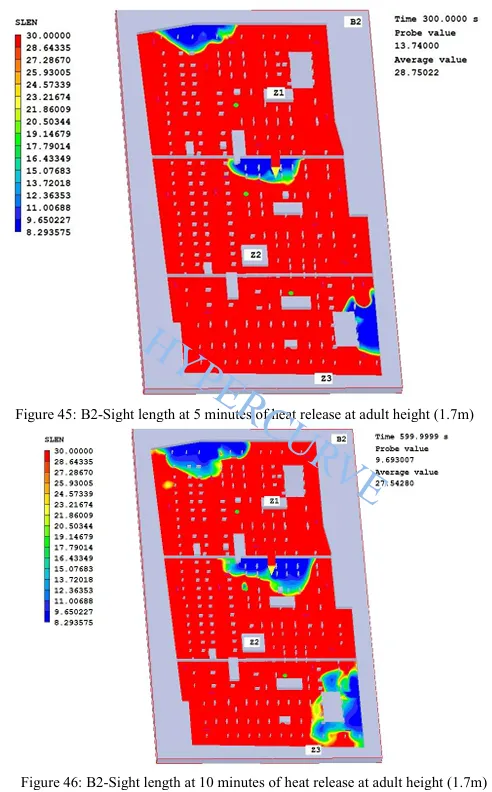
The B2 fire simulation follows the report's 4 MW, 2 m × 5 m passenger-car fire scenario. Smoke concentration, sight length and temperature contours are presented at adult height for 5, 10, 15, 20, 25 and 33 minutes. The supplied report states that smoke leakage from fire zones is not considered, so that assumption should be retained when interpreting the results.
Engineering Interpretation
Assessment criteria and report limitations
The report defines its own assessment criteria, including normal ventilation at 6 ACPH, emergency ventilation at 12 ACPH, CO exposure thresholds and a sight-length objective of more than 30 m to an escape point within 15 minutes after the fire is extinguished. This webpage summarises the source report and does not independently verify whether every criterion is met.
Assessment Scope
- Normal ventilation at 6 ACPH and fire-mode ventilation at 12 ACPH.
- CO distribution at adult height and stated exposure thresholds.
- Smoke, sight-length and temperature contours for both basements.
Important Limitations
- The supplied report states that smoke leakage from fire zones is not considered.
- This webpage summarises the report and does not independently validate all results or criteria.
- Any compliance statement should be based on the complete simulation data, project assumptions and relevant approval process.
Study Parameters
Study Parameters
The supplied report covers two basement levels, with normal and fire ventilation modes and a defined passenger-car fire scenario.
Analysis Outputs
Analysis Outputs
The report presents the following output categories for review across both basement levels.
Project Deliverables
Analysis outputs covered in the case study
The following items summarise the model information and result visualisations described in the supplied report.
About HyperCurve Solutions
Planning a ventilation or fire study?
HyperCurve Solutions Private Limited provides engineering simulation services for fire and smoke movement, ventilation performance and building safety studies. CFD and FDS-based analysis can help project teams assess airflow patterns, contaminant distribution and smoke behaviour under defined scenarios.
Assess airflow distribution, CO levels and smoke movement using project-specific engineering simulation.