Project Case Study

Solar Farm CFD Analysis

A computational fluid dynamics study evaluating wind-induced velocity, pressure and temperature patterns around photovoltaic module mounting structures for 0° and 15° wind-direction cases.

Solar FarmWind Load CFDPV Mounting Structures0° / 15° Wind Cases

Tet4 mesh

27.7M elements

Inlet velocity

20 m/s

Wind direction cases

0° / 15°

Turbulence model

SST k-ε

Project summary

Project at a Glance

The simulation examines how wind interacts with rows of photovoltaic panels and how the resulting flow field varies with wind direction.

Two wind-direction cases—0° and 15°—were compared using velocity, pressure and temperature contours to interpret shielding and wake effects across the solar farm.

Study domain

Three-dimensional solar farm and PV mounting structures

Mesh

27.7 million Tet4 elements

Inlet velocity

20 m/s

Wind directions

0° and 15° cases

Turbulence model

SST k-ε, as specified for the study

Outputs reviewed

Velocity, pressure and temperature contours

01 / Context

Project Overview

HyperCurve Solutions assessed wind flow around a solar farm using a three-dimensional CFD model. The study considered the interaction between incoming wind and the PV mounting rows, reviewing flow velocity, pressure distribution and temperature contours for the selected wind directions.
02 / Scope

Project Objectives

The objective was to compare the aerodynamic behaviour of the solar farm under 0° and 15° wind-direction cases, identify regions of higher windward pressure, and interpret how upstream rows shield interior tables while downstream wakes affect airflow and temperature patterns.

Model preparation

Solar Farm Model Setup

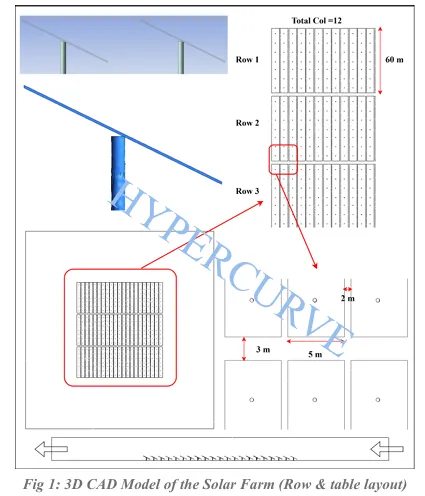
The three-dimensional model and computational mesh were prepared to represent the PV mounting layout and the flow domain used for the wind-direction comparison. The setup included inlet, outlet and wall boundary-condition representation.

Three-dimensional CFD model setup for the solar farm
Solar farm CFD model setup and computational domain

Simulation parameters

A consistent basis for comparison

The reported model uses a 27.7-million-element Tet4 mesh, an inlet velocity of 20 m/s and the specified SST k-ε turbulence model. The 0° and 15° cases provide a basis for comparing the flow field under the two assessed wind directions.

The contour images below illustrate the reported velocity, pressure and temperature distributions.

Mesh and boundary setup

Mesh and Boundary Conditions

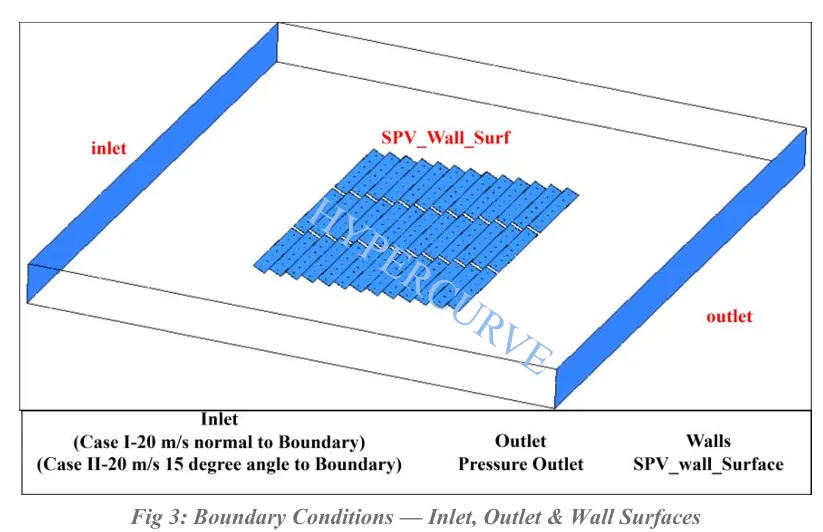
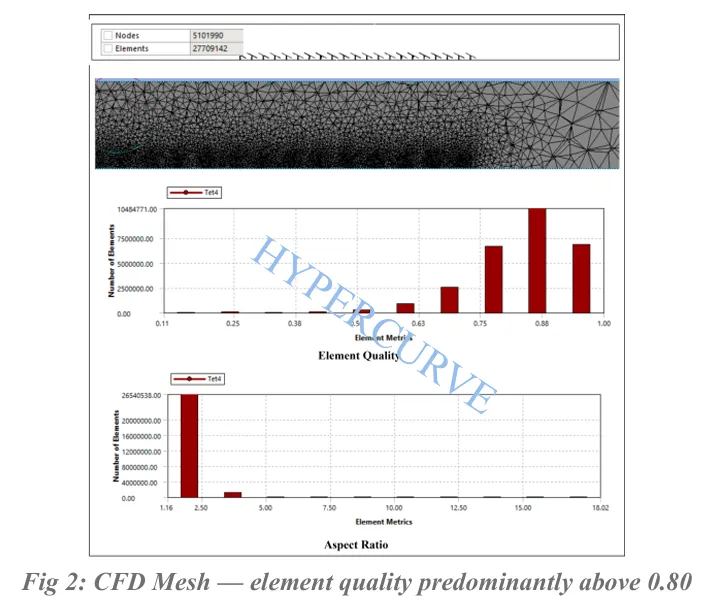
The report presents the CFD mesh and element-quality distribution, noting that element quality is predominantly above 0.80. Boundary conditions include an inlet, pressure outlet and wall surfaces representing the PV module mounting structure.

CFD mesh and element quality distribution for the solar farm
CFD mesh and element quality distribution
Inlet, outlet and wall boundary conditions for the solar farm CFD model
Boundary conditions showing inlet, outlet and wall surfaces

Case I

20 m/s normal to the boundary.

Case II

20 m/s at a 15° angle to the boundary.

Air movement

Velocity Contour Results

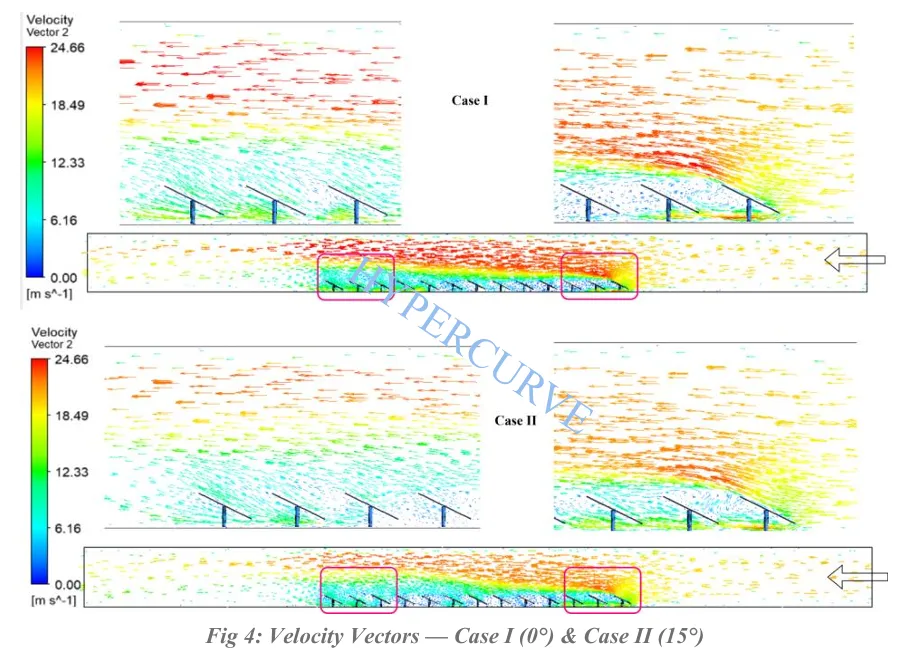
Velocity contours help show how the incoming wind travels through and around the PV mounting rows for the assessed wind directions.

Velocity contour results for solar farm CFD analysis
Velocity contours — comparison of the assessed wind-direction cases

The flow field is affected by the arrangement of the upstream and downstream panel rows. Upstream rows can shield interior tables, while wakes behind the structures influence the airflow reaching rows farther downstream.

Engineering implication: review local flow patterns around the mounting rows rather than relying only on the inlet wind speed.

Wind loading

Pressure Contour Results

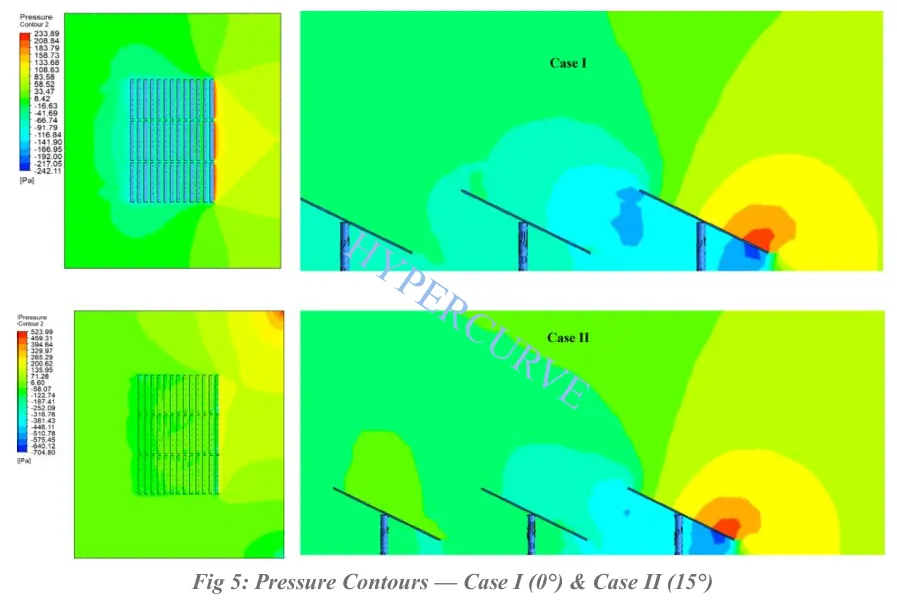
Pressure contours are used to review how wind pressure is distributed over the PV mounting structures in the two wind-direction cases.

Pressure contour results for solar farm CFD analysis
Pressure contours — windward and shielded regions across the solar farm

Windward exterior tables

The reported assessment identifies the windward exterior tables as the locations experiencing the highest pressure.

Interior rows

Upstream rows provide a shielding effect for interior tables, changing the local wind exposure across the array.

Thermal distribution

Temperature Contour Results

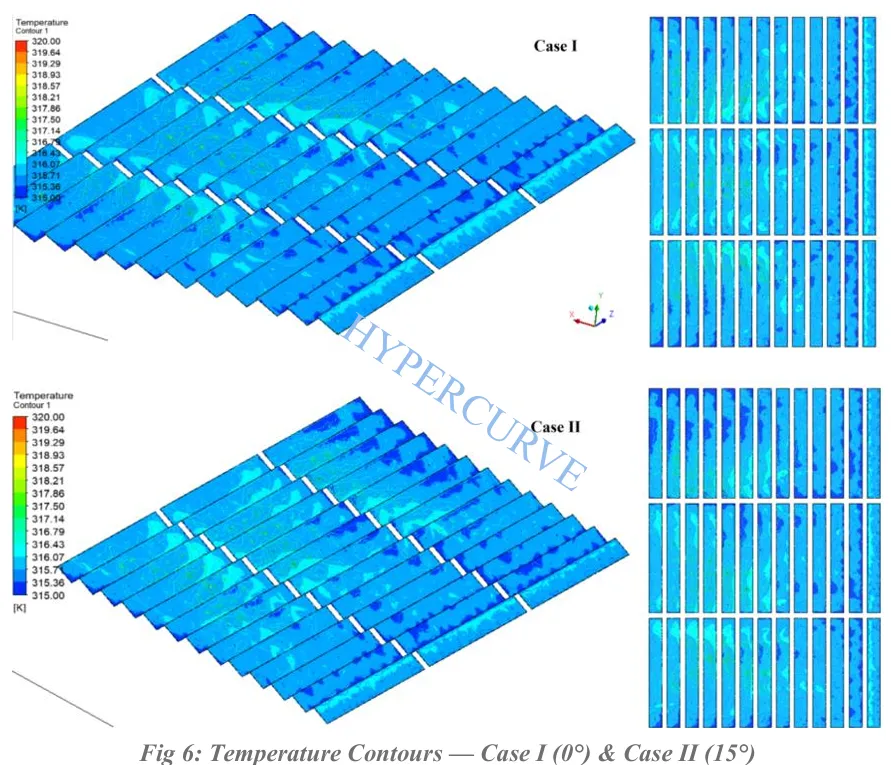
Temperature contours provide an additional view of the flow field and help illustrate the influence of wakes and downstream airflow through the solar farm.

Temperature contour results for solar farm CFD analysis
Temperature contours — distribution across the solar farm domain

The reported results indicate that wake effects influence downstream airflow and temperature patterns. These patterns should be interpreted alongside velocity and pressure results to understand the overall flow behaviour.

Review temperature distribution together with wind direction and the shielding created by upstream panel rows.

Engineering interpretation

Key Findings and Engineering Value

The findings below summarise the reported contour interpretation for the assessed solar farm model and wind-direction cases. Final structural design should be checked against project-specific conditions and applicable engineering standards.

01

Wind shielding

Interior tables receive protection from upstream rows, illustrating the shielding effect created by the solar-panel layout.

02

Highest pressure

The windward exterior tables experience the highest pressure in the reported assessment.

03

Wake effects

Downstream rows influence airflow and temperature patterns as wind passes through the solar farm.

Comparing multiple wind directions helps identify how array orientation and row-to-row interactions influence pressure and downstream flow patterns. The results can inform further engineering review of PV mounting structures.

Project outputs

Project Deliverables

The assessment brings together model preparation and contour outputs to support review of wind behaviour around the solar farm.

  • Three-dimensional solar farm CAD model review
  • CFD mesh and mesh-quality visualisation
  • Inlet, outlet and wall boundary-condition representation
  • Velocity-vector comparison for 0° and 15° wind directions
  • Pressure contour comparison for both cases
  • Temperature contour comparison for both cases
  • Summary of wind shielding, wake effects and design implications