Project Case Study

Luxury Villa CFD Analysis

HVAC airflow distribution and thermal comfort evaluation across bedrooms, living areas and the kitchen.

HVAC Airflow3D CFD ModelTemperature ContoursAir VelocityIndoor Comfort

Building

Luxury villa

Time snapshots

120s & 240s

Evaluation heights

1.0 m & 1.5 m

Result fields

Temp + velocity

Project summary

Project at a Glance

This CFD study reviewed how conditioned air moves through the villa and how the temperature field develops over the reported simulation period.

The comparison focused on temperature and velocity patterns at 120 seconds and 240 seconds, at two heights above the floor.

Building

Luxury villa with HVAC ductwork

Spaces assessed

Bedrooms, living areas and kitchen

Result fields

Temperature and air velocity

Evaluation heights

1.0 m (occupant) and 1.5 m (standing) above floor level

Comparison times

120 seconds and 240 seconds

01 / Context

Project Overview

HyperCurve Solutions Private Limited carried out a Computational Fluid Dynamics (CFD) assessment of the villa’s HVAC ductwork and interior room layout. The study reviewed the movement of conditioned air and temperature development across bedrooms, living areas and the kitchen.
02 / Scope

Project Objectives

The analysis was intended to check whether supply air reached the occupied spaces effectively and to understand how the temperature field developed over the reported simulation period, at both occupant level (1.0 m) and standing height (1.5 m).

Model preparation

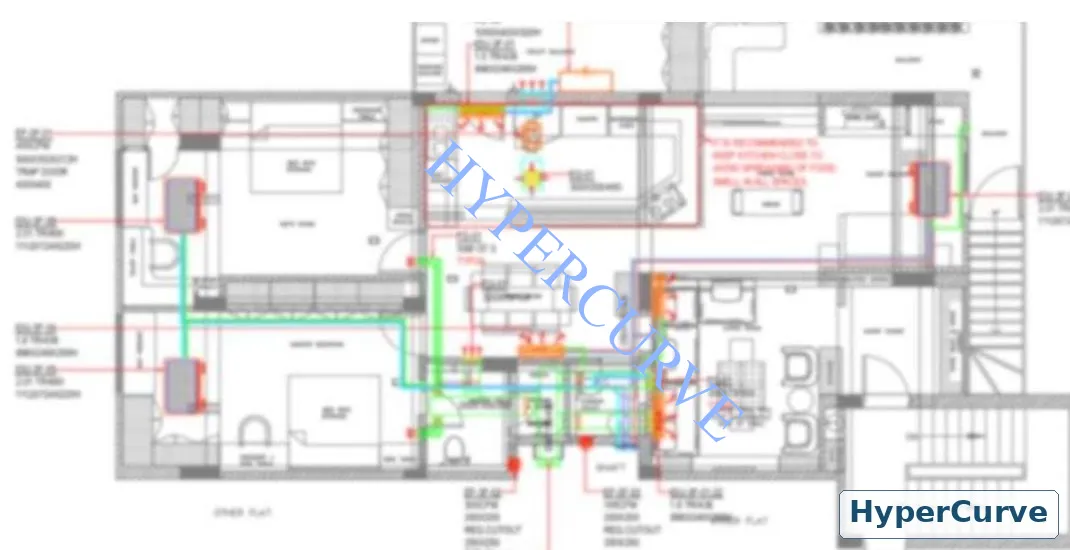
HVAC Ducting Layout

The supply and return duct routing was reviewed against the villa floor plan to understand how conditioned air was intended to reach the individual rooms. This layout formed the basis for the three-dimensional CFD representation.

HVAC supply and return duct routing on the luxury villa floor plan
Supply and return duct routing across the villa floor plan

Simulation setup

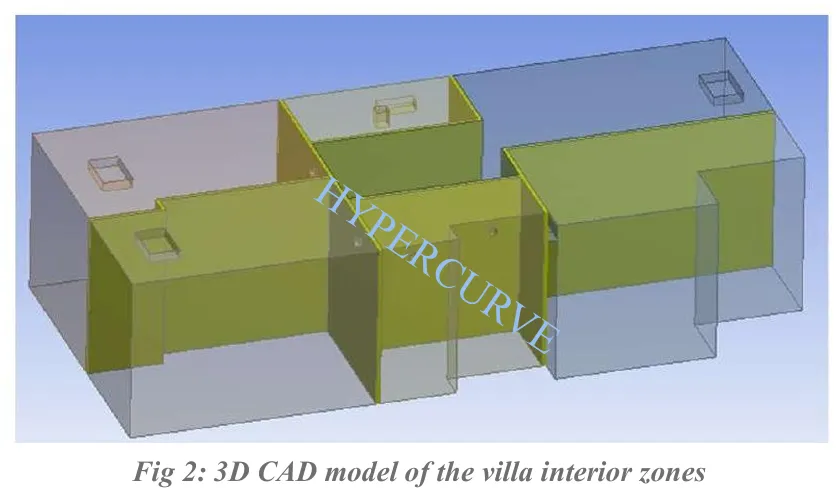
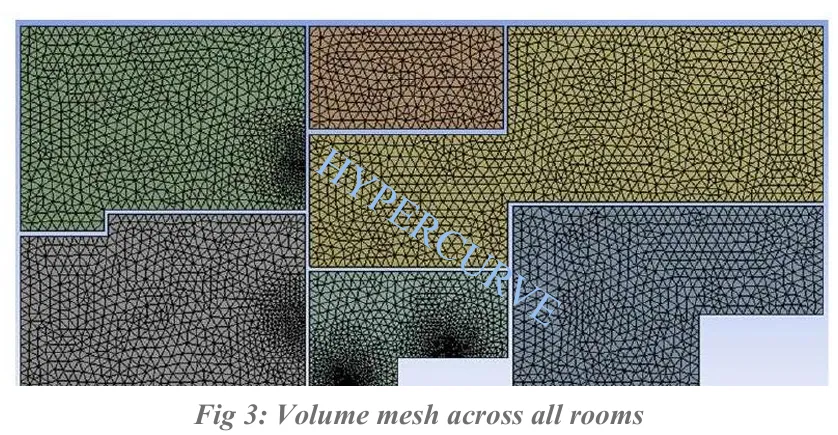
CFD Geometry and Volume Mesh

The interior zones were represented using a 3D CAD model, followed by volume meshing across the room spaces. The geometry and mesh provided the computational domain used to calculate airflow and temperature distribution.

Three-dimensional CAD model of the villa interior zones
3D CAD model of the villa interior zones
Volume mesh distributed across the villa rooms
Volume mesh across the rooms

Simulation results

Temperature Distribution at 1 m

Temperature contours at 1 m above floor level were compared at 120 seconds and 240 seconds.

CFD temperature contours at one metre height comparing 120 and 240 seconds
Temperature contours at 1 m occupant level — 120 s and 240 s

The supplied report shows progressive cooling between these times. By 240 seconds, most zones move towards the green-blue range shown in the plotted temperature scale, while the room receiving AC supply reaches cooler conditions first.

The contour plots provide a spatial view of the changing thermal field, highlighting that temperature development varies by room and by proximity to the conditioned-air supply.

Air movement

Air Velocity at 1 m

Velocity contours at occupant level show the supply-air jets extending across the rooms.

CFD air velocity contours at one metre height comparing 120 and 240 seconds
Air velocity at 1 m occupant level — 120 s and 240 s

The report describes the airflow patterns as broadly consistent between 120 seconds and 240 seconds, with visible air movement through the evaluated spaces.

Supply-air jets are visible extending into the room spaces at both reported time steps.

Standing height

Results at 1.5 m Standing Height

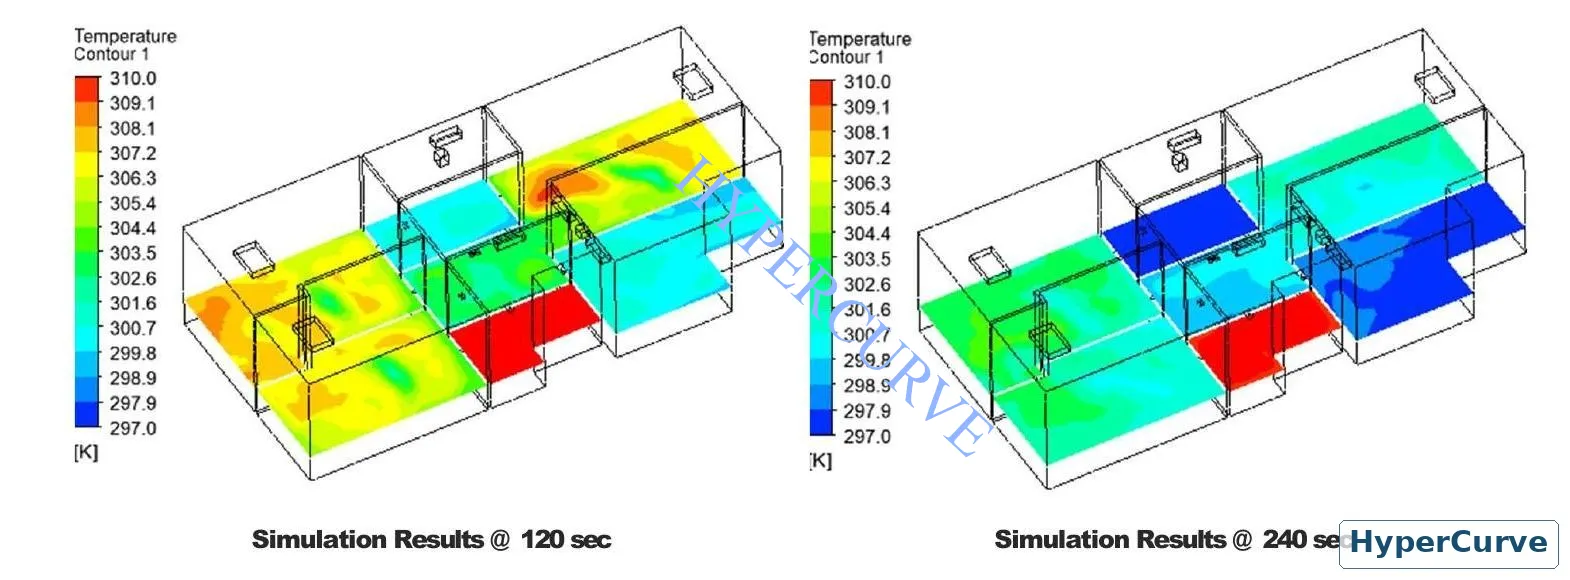
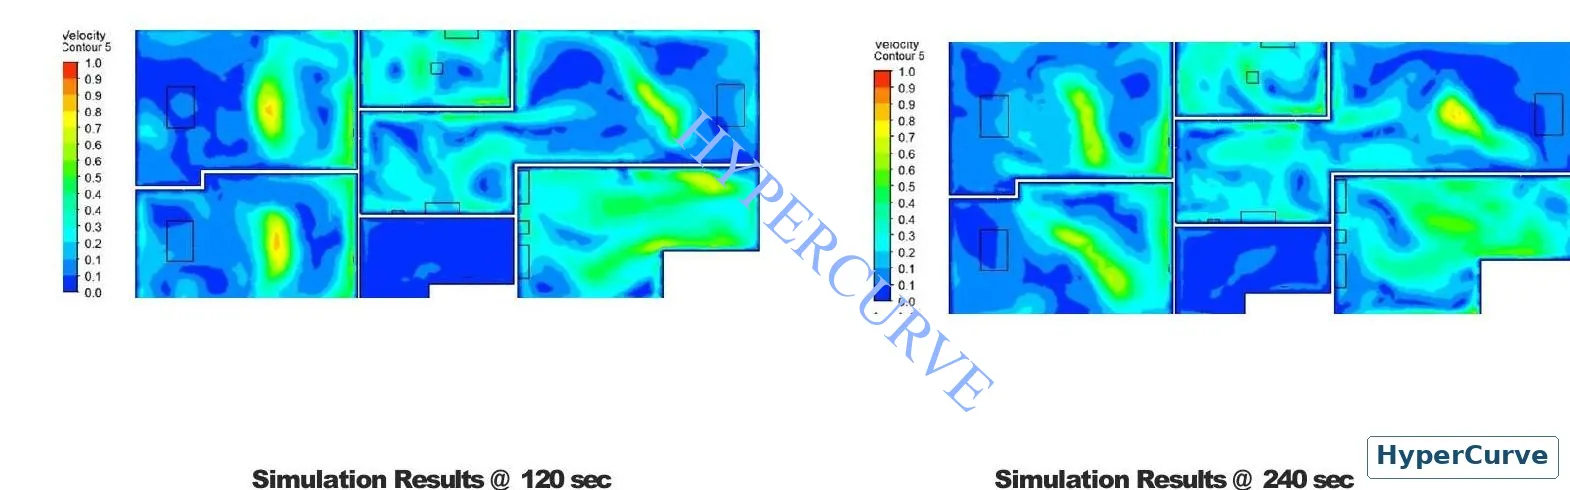
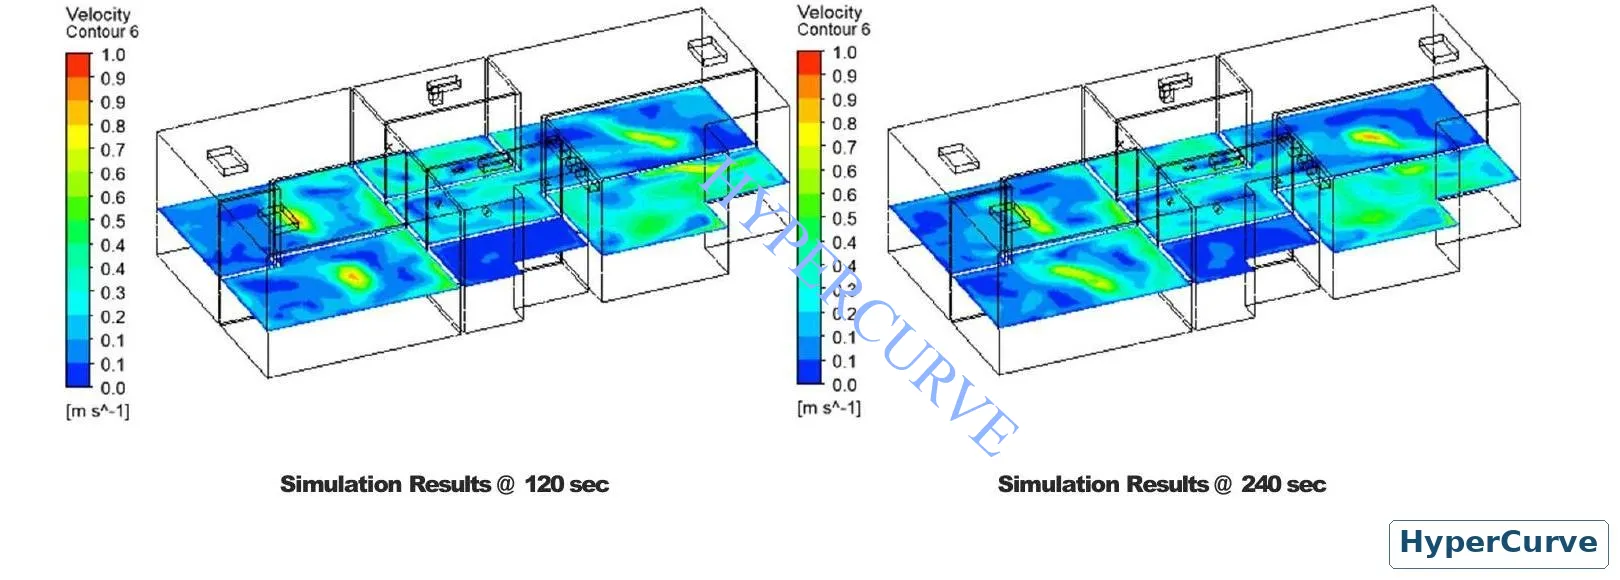
The analysis was also reviewed at 1.5 m above floor level to examine temperature and airflow trends at a higher standing plane. The report states that the trends were similar to those at 1 m, indicating that the observed distribution was not limited to one horizontal plane.

CFD temperature contours at 1.5 metre height comparing 120 and 240 seconds
Temperature at 1.5 m standing level — 120 s and 240 s
CFD air velocity contours at 1.5 metre height comparing 120 and 240 seconds
Air velocity at 1.5 m standing level — 120 s and 240 s

Sectional review

Additional Cross-Section Results

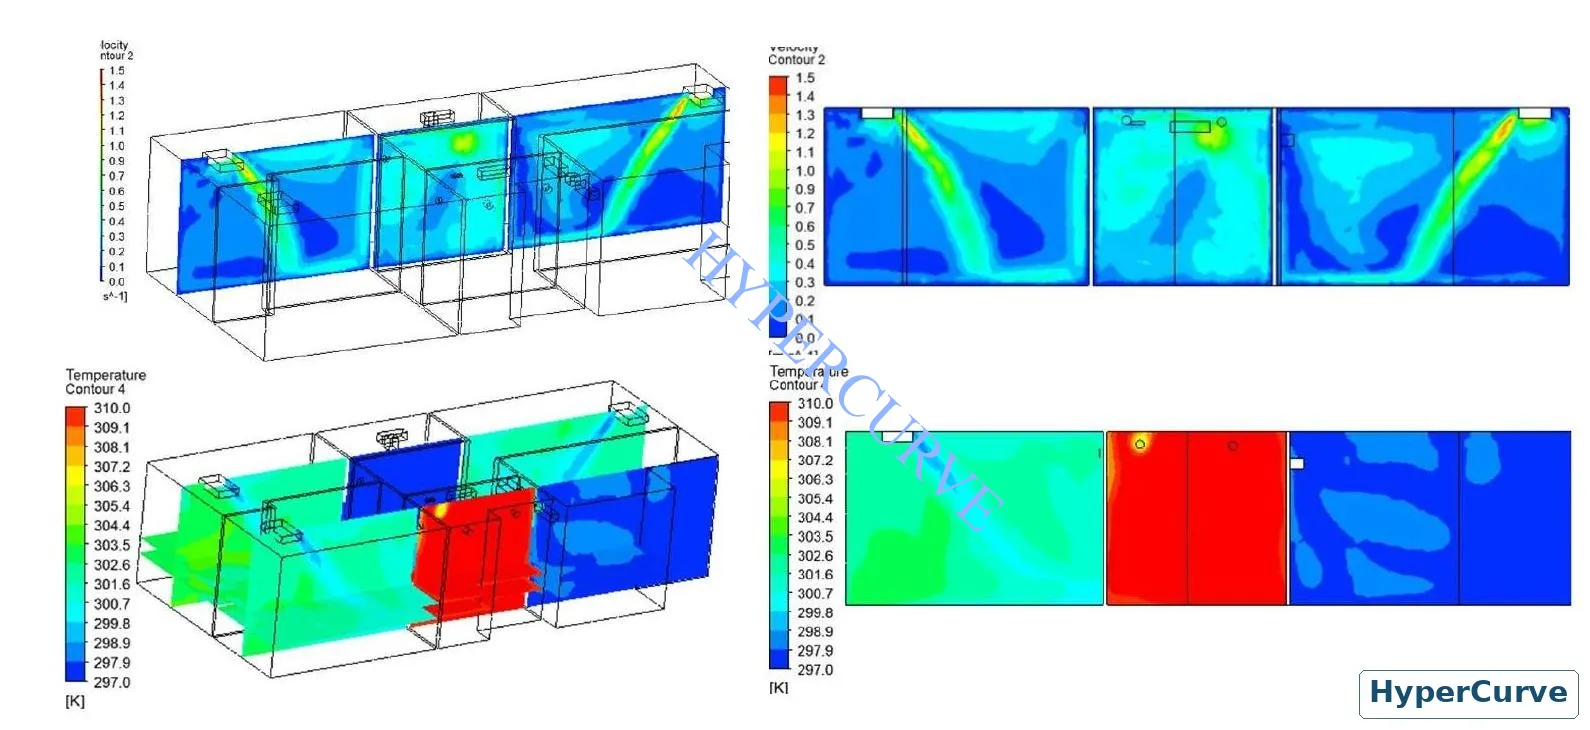
Supplementary cross-sections provide another view of velocity and temperature distribution through the villa.

Additional CFD velocity and temperature cross-sections at 240 seconds
Supplementary velocity and temperature cross-sections at 240 s

What the section reveals

Supply air penetrating the rooms

In the supplied report, these views are described as showing supply air penetrating the rooms without an obvious short-circuit path back to the return. The report did not identify abnormal heat-retention zones in the evaluated results.

Engineering interpretation

Key Findings

These findings describe simulation outputs for the configuration reported in this case study.

01

Air reaches the rooms

The proposed HVAC duct layout showed air distribution across bedrooms, living areas and the kitchen.
02

Progressive cooling

Temperature contours showed progressive cooling from 120 s to 240 s.

03

Consistent supply jets

Velocity contours showed supply-air jets extending into the room spaces, with broadly consistent patterns across the two reported time steps.

04

Similar at standing height

Temperature and velocity trends at 1.5 m were similar to those at 1 m.

05

No obvious short-circuit

The additional cross-sections did not indicate an obvious supply-to-return short-circuit path or abnormal heat-retention zones in the presented results.

Project outputs

Engineering Value and Deliverables

The CFD study provides a visual engineering assessment of the proposed HVAC layout before relying solely on post-installation observations. Reviewing temperature and velocity at two heights and two time steps gives the design team a broader understanding of airflow distribution and thermal development.

  • HVAC duct layout review
  • 3D villa interior CFD model and volume mesh
  • Temperature contour comparisons at 1 m and 1.5 m
  • Air velocity contour comparisons at 1 m and 1.5 m
  • Additional temperature and velocity cross-sections
  • Summary of airflow distribution and thermal trends

Technical note: This page summarises the supplied CFD report. The findings describe simulation outputs; they should not be presented as measured post-installation performance or as a client testimonial.