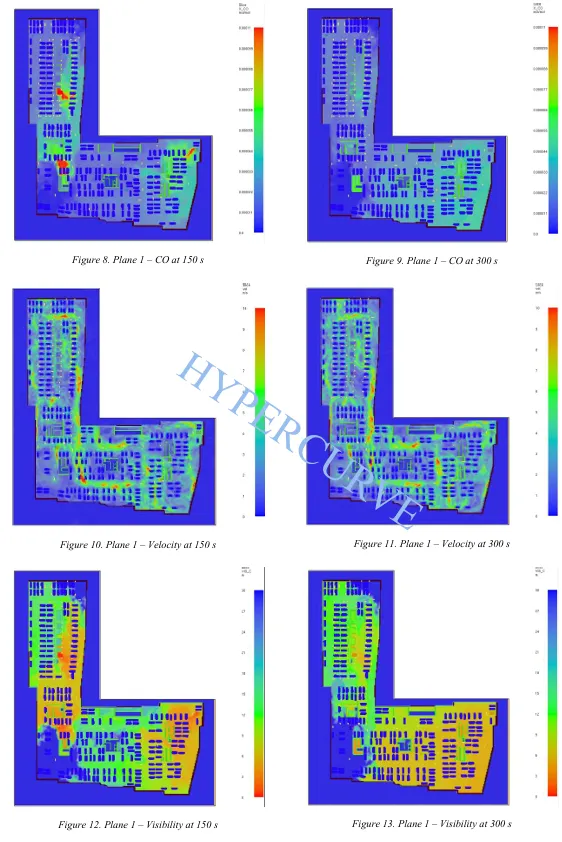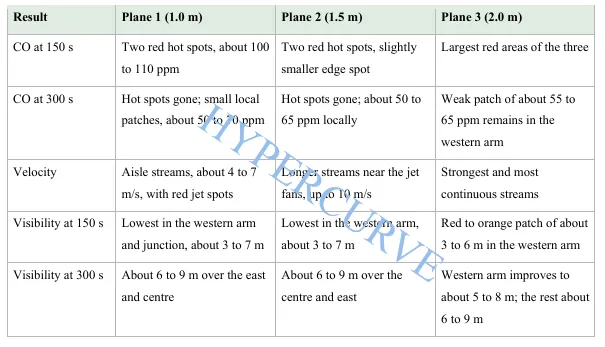
Result Plane · 1.0 m
Results at 1.0 m height
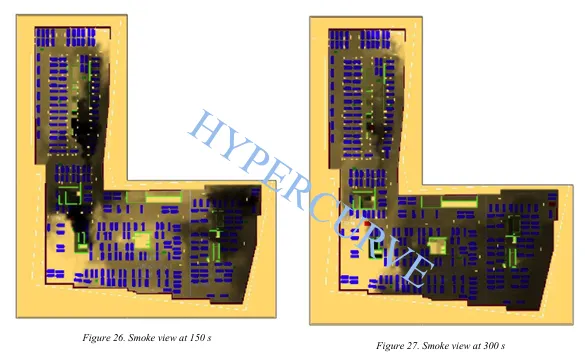
The report shows local CO concentration patches around the western arm and junction at 150 seconds. The strongest plotted areas reduce by 300 seconds, although local airflow and visibility variations remain.
Concentrations, velocities and visibility values should be interpreted alongside the original FDS output and plotted colour scales.